Dashboards and Dynamic Dashboards in Salesforce Lightning
Built with source reports, filters, and components, dashboards are a great way to visualize your reports in one place. With dynamic dashboards Salesforce transforms views from user to user. You’ll hear again and again how customizable Salesforce is and that’s because it’s true!
Choosing data sources and create the perfect calculation and formatting to display the data you want. The best part? You can even customize the color theme and stay on brand. With this quick “How-To” you’ll learn the basics of creating dashboards in Salesforce Lightning and build a better experience for users. Let’s get started!
Understanding Lightning Report Builder
To better utilize Salesforce dashboards, it’s of key importance to understand the Lightning Report Builder. First, know that reports you create through the builder are known as source reports. Each source report provides data for your components. Different components can have different source reports. However, each component only has one source. Got that?
Next, readers can scope the data, AKA the components, they see in the dashboard to a particular view using filters. Each component has a set of properties that allow you to customize the component to show the data that you want. With these features, you can work more effectively by presenting the most relevant data.
Creating Dashboards in Salesforce Lightning
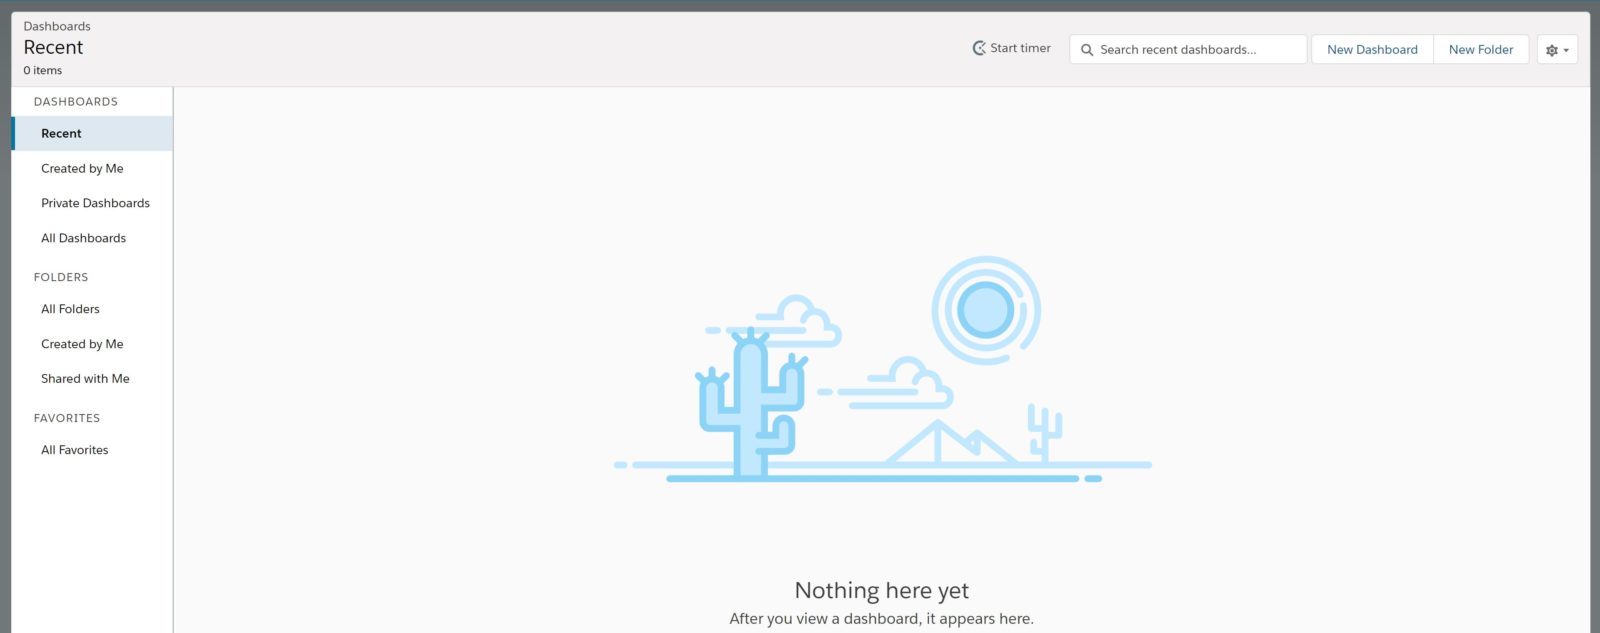
To create or edit a Salesforce Dynamic Dashboard, navigate to the Dashboards tab, click New Dashboard to create or click on an existing dashboard to edit.
First, when building a new dashboard, name it, add a description if you’d like, and select the right folder for proper organization.
Remember: Be sure to store these reports in folders that the intended dashboard viewers can access. Otherwise, they will not be able to see the results in the component.
To add a component to the dashboard, press + Component.

Choose a source report for the component, then press Select.

Customize how the component displays data, then press Add.
You can arrange or resize the component as you like within the edit grid.
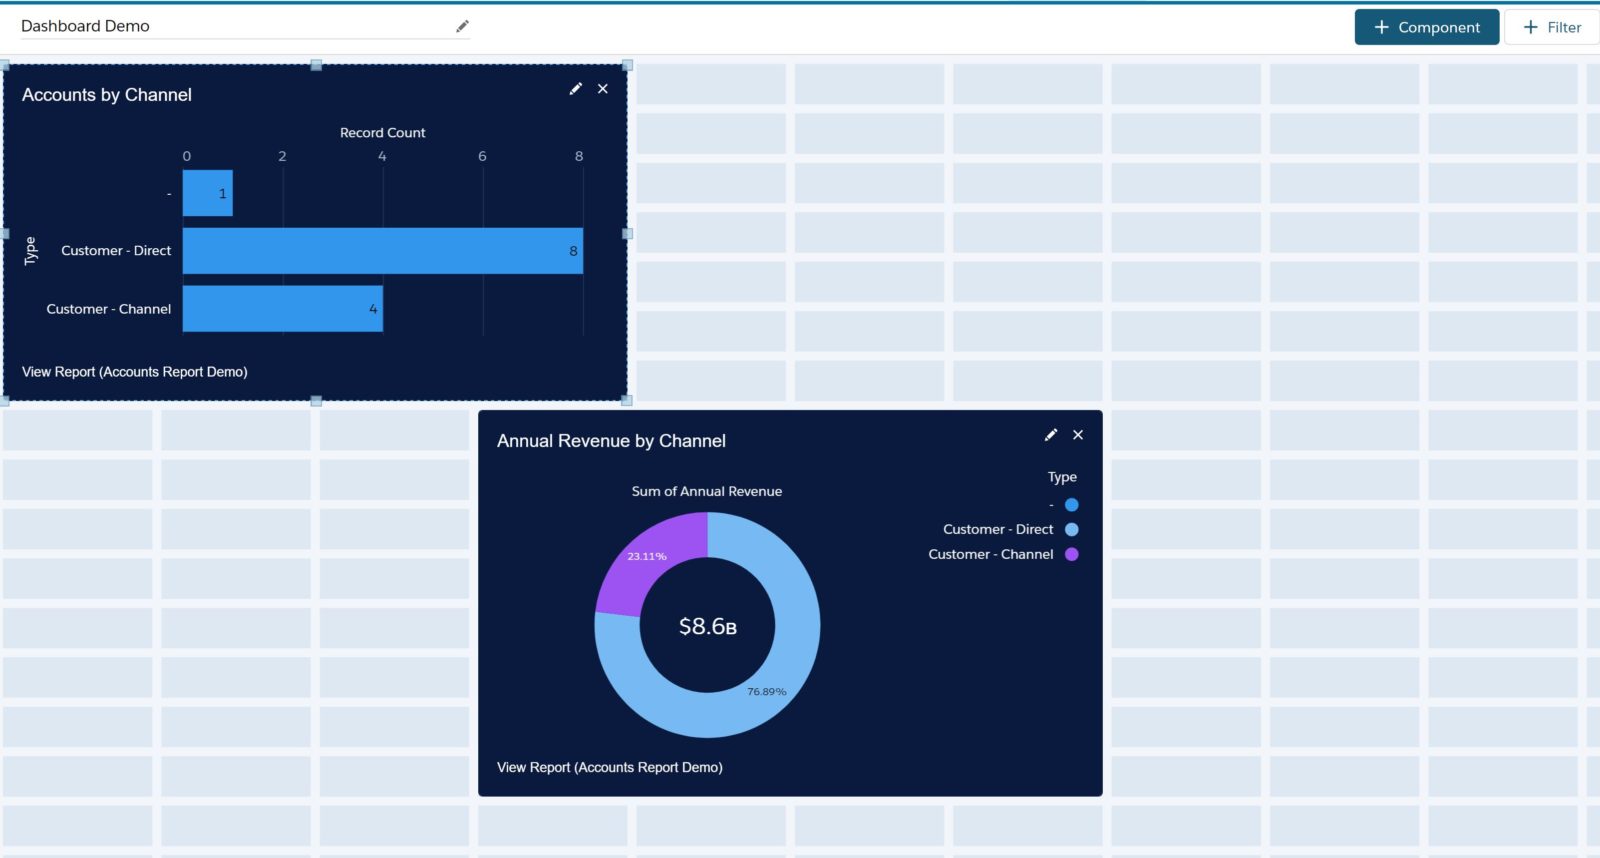
To edit an existing component, press the pencil icon on the component.

To remove a component, press the X on the component.
To add a filter to the dashboard, press + Filter.
From the Field drop-down, select a field to filter on. The drop-down shows fields that can be used to filter all the dashboard’s components.
Next, give the filter a Display Name for easy identification. Then, simply assign values to the filter by clicking Add Filter Value.

Assigning Viewers for Dynamic Salesforce Dashboards
To specify which users can view the dashboard, click the gear icon (Properties) to open the Properties menu. Under View Dashboard As, choose ‘who’ people view the dashboard (and all source reports) as. Users could see more or less data than they normally see elsewhere in Salesforce. Be careful not to reveal sensitive information to too broad an audience.
How to Create Different Salesforce Dashboard Views
Selecting “Me” shows the viewers the dashboard as you would see it, permissions withstanding.
Selecting “Another person” users view the dashboard as whomever you choose. The default person is you. To choose someone else, click the X icon (Remove person) to remove you. Then, select from any user in your organization.
You may also let users choose whom they view the dashboard as by checking the box next to “Let dashboard viewers choose whom they view the dashboard as”. The user must have the appropriate user permissions to choose who they view the dashboard as (assigned in User Permission Setup). With the “View My Team’s Dashboards” user permission, the user views the dashboard as themselves or as anyone beneath them in the role hierarchy. With the “View All Data” user permission, users can view the dashboard as anyone.
More on Dynamic Dashboards
By selecting “The dashboard viewer” users see data as themselves, according to their own access to data. Specifically, this is what we call dynamic dashboards. This powerful tool can be great and save loads of time by eliminating the need to create separate dashboards for each user. However, salesforce dynamic dashboards do present some limitations. Salesforce dynamic dashboards don’t support the ability to follow components (following components can only be done in Salesforce Classic at this time). Additionally, you can't save dynamic dashboards in private folders or schedule refreshes for dynamic dashboards. Instead, you have to refresh manually.

Knowledge Check: Your organization can have up to 5 dynamic dashboards for Enterprise Edition, 10 for Unlimited and Performance Edition, 3 for Developer Edition, and you purchase additional dashboards. Unfortunately, dynamic Salesforce dashboards aren’t available in other editions.
Final Touches
The properties section is where you may optionally rename the dashboard, add a description, change the folder in which it is stored, and change the grid size, theme or color palette.

Customize colors in your dashboard by choosing a light or dark theme and one of 14 color palettes. Themes and color palettes help you organize custom data in your dashboard. This is exclusive to the Salesforce Lightning experience.
You may set the theme for the entire dashboard (done in properties) or for individual components (done in component edit).

Wildflowers is the default color palette, but if you need an accessible color palette, choose Mineral.
Press Save when finished with your customizations.
When you are finished designing your Dashboard press Done.
To Subscribe to a Dashboard press Subscribe.

Then, select the Frequency which will specify the days and times that it will be sent!

You may also set it to send an email any time the Dashboard is refreshed.
The Power is Now in Your Hands
There’s your overview of Lightning Dashboards, now it’s time to get creating! Dashboards are an awesome practice to organize, inform, and even motivate your team. With information and visualization at the fingertips of users, your business is set to grow. Remember, if you need extra resources, Silo Connectors offers On-Demand Salesforce Administrators who are happy to create a solution.